Building a Real-Time IoT Simulation with Microsoft Fabric
- Michelle Schulz
- Apr 27
- 6 min read
Real-time data processing is becoming an essential part of modern data platforms. Instead of collecting data and analyzing it later, organizations increasingly need to react immediately when events occur.

Milka Kutseva
Senior Data Engineer
This shift is driven by the growing demand for faster insights and more responsive systems. In many scenarios, even short delays can reduce the value of data or impact critical decision-making.
Real-time processing is particularly relevant in areas such as IoT monitoring, system performance tracking, and anomaly detection, where data is continuously generated and needs to be interpreted without delay.
This blog post outlines the fundamentals of real-time data streaming and demonstrates them through a simple IoT simulation built in Microsoft Fabric.
From Batch to Real-Time Thinking
Many traditional systems rely on batch processing, where data is collected and processed at specific intervals - for example every hour or once per day.
While this approach works well for historical analysis, it introduces delays between data generation and insight creation. In fast-moving environments, this delay can be a limitation.
Real-time systems take a different approach:
data is continuously generated
events are processed as soon as they arrive
insights are available almost instantly
This allows organizations to move from reactive to proactive behavior. Instead of analyzing what already happened, they can respond while things are still happening.
At the same time, real-time systems require a different way of thinking, because the data is no longer static - it is always changing.
Real-Time Architecture in Microsoft Fabric

Understanding the Architecture
The diagram above illustrates how real-time data flows through Microsoft Fabric and how different components work together to create a complete streaming solution.
The process can be grouped into three main stages:
Ingest & Process
Data is collected from various sources such as APIs, databases, or streaming systems. Eventstream is responsible for receiving this data and handling it as a continuous flow.
At this stage, the system focuses on reliability and speed, ensuring that events are ingested without delays or data loss.
Analyze & Transform
Once the data is ingested, it can be stored and analyzed in Eventhouse, which is optimized for fast processing of streaming data.
This stage is where the raw data becomes useful. It can be filtered, structured, or enriched, depending on the needs of the solution.
Visualize & Act
The processed data is then used for:
dashboards that show live data
reports for deeper analysis
automated actions triggered by specific conditions
This enables not only observation but also automation, which is one of the key advantages of real-time systems. At the foundation of this architecture is OneLake, which provides a unified storage layer and allows different components to work seamlessly together.
How Real-Time Data Pipelines Work
A real-time data pipeline follows a simple but powerful idea: data flows continuously through the system instead of being processed in large batches.
The main steps include:
Data is generated (for example by devices or applications)
It is sent to the platform through an ingestion layer
It is processed or transformed as it arrives
It is stored for analysis or further usage
It is visualized or used to trigger actions
Each event becomes part of an ongoing stream, and the system is constantly updating its state based on new information.
This approach allows near real-time insights, but it also requires careful design to ensure stability and performance.
Ways to Ingest Streaming Data in Fabric
Microsoft Fabric supports several ways to ingest streaming data, depending on the complexity of the scenario.
API / Custom endpoint
This is a simple and flexible option, often used for testing and simulations. It allows data to be sent directly from scripts or applications.
Event Hubs or Kafka
These are more advanced options used in production environments where large volumes of data need to be handled reliably and at scale.
Power Automate
A low-code alternative that allows users to create event-driven flows without writing code, making it accessible for business users.
Use Case: IoT Monitoring
To demonstrate how real-time processing works, a simple IoT scenario was created.
We simulate sensors in different rooms, each sending:
temperature
humidity
CO₂ levels
timestamp
The goal is to monitor these values continuously, identify unusual situations, and react if necessary. This type of scenario is very common in real-world applications such as smart buildings, industrial monitoring, or environmental tracking.
Data Simulation with Python
Instead of connecting to real devices, I generated data using a Python script.
The script creates random values and sends them every few seconds, simulating a live data stream. This approach is practical for demonstrations, because it allows full control over the data and makes it easier to test different scenarios, including anomalies.
It also helps to understand how streaming systems behave under continuous data flow.

Eventstream: Real-Time Ingestion
Eventstream is responsible for receiving the incoming data and directing it to the appropriate destination.
It acts as the central component that connects data sources with storage and analytics layers.
It also allows basic processing such as:
filtering events
modifying fields
preparing the data before storage
In this example, the data was already structured, so minimal transformation was required. However, in real-world scenarios, this step is often important for ensuring data consistency.

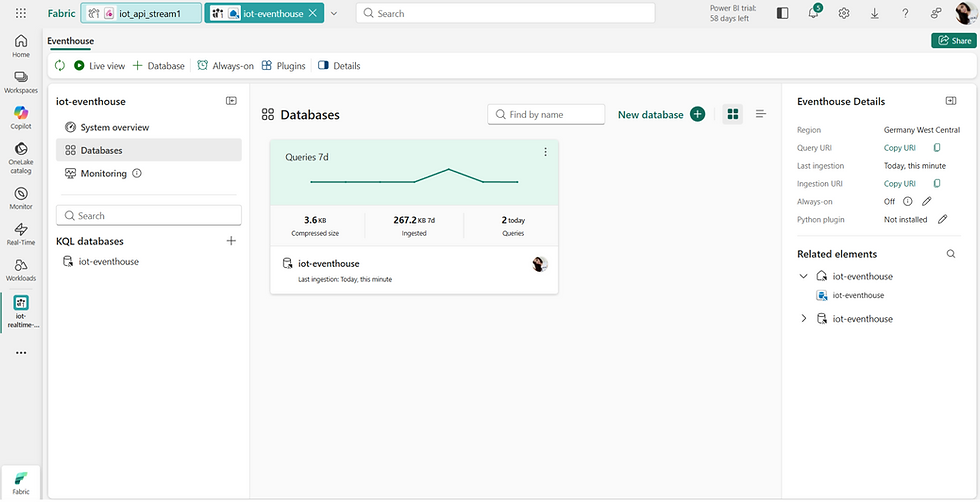
Eventhouse and Storage Options
The incoming data is stored in Eventhouse, which is optimized for real-time analytics and fast querying of streaming data. It allows efficient access to continuously ingested events and supports interactive analysis with minimal latency.
At the core of Eventhouse is the KQL database. KQL stands for Kusto Query Language, a query language originally developed for the Azure Data Explorer (Kusto) engine, which is designed specifically for large-scale log and telemetry analytics.
Unlike traditional relational databases, the KQL database is built for high-ingestion, append-only workloads. New events are continuously written to the system, while existing records are rarely updated. This design makes it highly efficient for scenarios such as IoT data, monitoring, and event tracking.
Data is stored in tables with a predefined schema, where each incoming event is recorded as a new row. Because ingestion is schema-based, column names and data types must match the target table definition to ensure correct processing.
The KQL engine is optimized for columnar storage and query execution, which allows it to scan and aggregate large volumes of data very quickly. Instead of focusing on transactional operations, it is designed for analytical workloads, where the goal is to explore and summarize data rather than modify it.
Another key characteristic is its strong support for time-based data. Since most streaming data includes timestamps, the engine is optimized to filter, group, and analyze data over time intervals. This makes it particularly effective for detecting trends, identifying anomalies, and retrieving the latest state of a system.
In addition, KQL provides built-in capabilities for aggregations, windowing, and real-time filtering, enabling fast and expressive analysis without complex query logic. As a result, it is well suited for monitoring dashboards and near real-time analytics scenarios.
Other storage options in Fabric
Eventhouse is only one part of the platform. Depending on the use case, other storage options can also be used:
Eventhouse (KQL Database)
Best suited for real-time scenarios and fast queries over streaming data. Optimized for time-series analysis, monitoring, and anomaly detection. Provides near real-time insights and supports event-driven architectures.
Lakehouse
Used for storing large volumes of historical data, typically in file formats such as Delta or Parquet. Well suited for data engineering, batch processing, and advanced analytics.
Warehouse
Designed for structured data and traditional reporting use cases. Supports SQL-based querying and is commonly used for business intelligence scenarios.
Real-Time Alerts with Activator
One of the most powerful aspects of real-time systems is the ability to react automatically to incoming data.
Using Activator, it is possible to define rules based on specific conditions. For example, if the temperature exceeds a certain value, the system can trigger an alert.
These alerts can send notifications such as emails, allowing users to respond immediately without constantly monitoring dashboards.
This transforms the system from passive monitoring to active response.

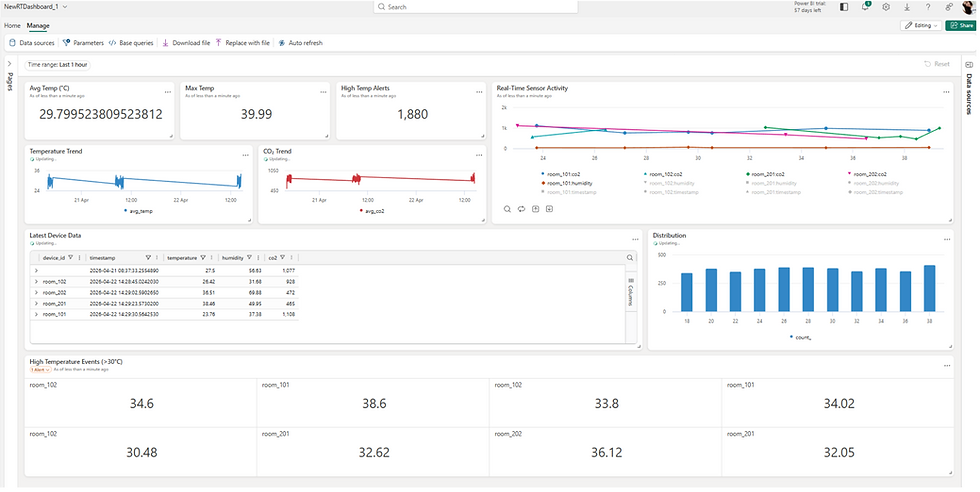
Visualization Options
Streaming data can be visualized in different ways depending on the purpose.
Real-time dashboards provide immediate insights into current values, while reporting tools such as Power BI allow more detailed analysis.
In this example, the dashboard shows how values change over time and highlights the latest measurements for each room.
Visualization plays an important role because it turns raw data into understandable information.
Costs
Using Eventstreams requires a paid Microsoft Fabric capacity.
The appropriate capacity level depends on several factors, including the volume of incoming data, how frequently events are processed, and how long the streaming pipelines are running.
For smaller workloads, lower capacity levels may be sufficient, while more complex or high-volume scenarios require higher capacity.
More information about pricing can be found here.
It is also important to monitor how resources are being used, especially in real-time scenarios where processing happens continuously. Guidance on monitoring capacity usage is available here.
To optimize costs, Eventstreams can be paused or deactivated when they are not needed. This helps reduce unnecessary load and keeps the environment efficient.
Conclusion
Real-time data processing allows organizations to move beyond traditional batch systems and respond immediately to events as they occur.
With Microsoft Fabric, it is possible to build a complete real-time pipeline with relatively simple setup, combining ingestion, processing, storage, and visualization in one platform.
Even with a simple simulation, it becomes clear how data can flow continuously, how it can be analyzed in near real time, and how systems can react automatically when certain conditions are met.


Comments